


Oil looks set to break out higher.
The $70 area was a formidable barrier for Brent Crude oil for two years—until it was overcome decisively in September 2021, as you can see from the chart below. After hurdling $70/$72 resistance, that price zone became support and propelled oil to its $139 high in March 2022.
From that high, oil declined to $70—its former resistance. In my July 12 column, I wrote that “Oil Is Bottoming Out—Finally.” After having tested the $70 area three times and making higher lows, Brent Crude decisively hurdled its downtrend three weeks ago. Adding to the bullish action, it also climbed decisively above its 11-week moving average.
I wrote that a weekly close above $80 would turn the trend bullish. Hurdling $89 on a weekly close would send Brent out of its year-to-date trading range and generate upside projections to $100-$110.
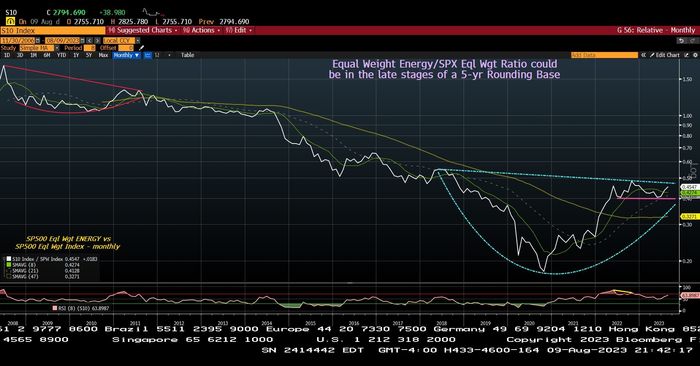
The chart below illustrates why I recommended some energy stocks to my clients. The
S&P 500 Equal Weight Energy
index is on the verge of breaking out of a five-year base against the
S&P 500 Equal Weight
index. An upside breakout would project a multiyear outperformance of energy stocks vs. the broader market.
A weekly close for
Brent Crude
above $89 would project an advance to the $100-$110 area. With their bullish price action (pricewise and on a relative basis), energy stocks are anticipating that oil prices will be breaking out of their year-to-date price range in the coming weeks.
Andrew Addison is the author of The Institutional View, a research service that focuses on technical analysis.
Write to [email protected]
Read the full article here


?")


